Looking at cross sections
The following code demonstrates how to produce plots showing the cross sections for important ionisation and recombination processes.
"""Example: Plotting cross sections"""
from matplotlib.pyplot import show
import ebisim as eb
# The cross section plot commands accept a number of formats for the element parameter
# This example shows the different possibilities
# The first option is to provide an instance of the Element class
potassium = eb.get_element("Potassium")
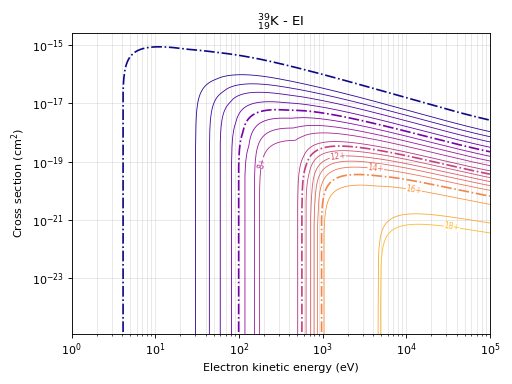
# This command produces the cross section plot for electron impact ionisation
eb.plot_eixs(element=potassium)
# If no Element instance is provided, the plot command will generate one internally based
# on the provided specifier
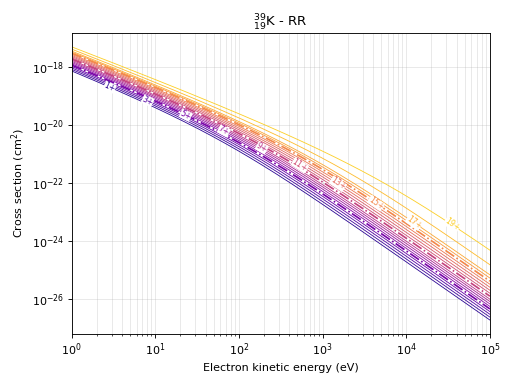
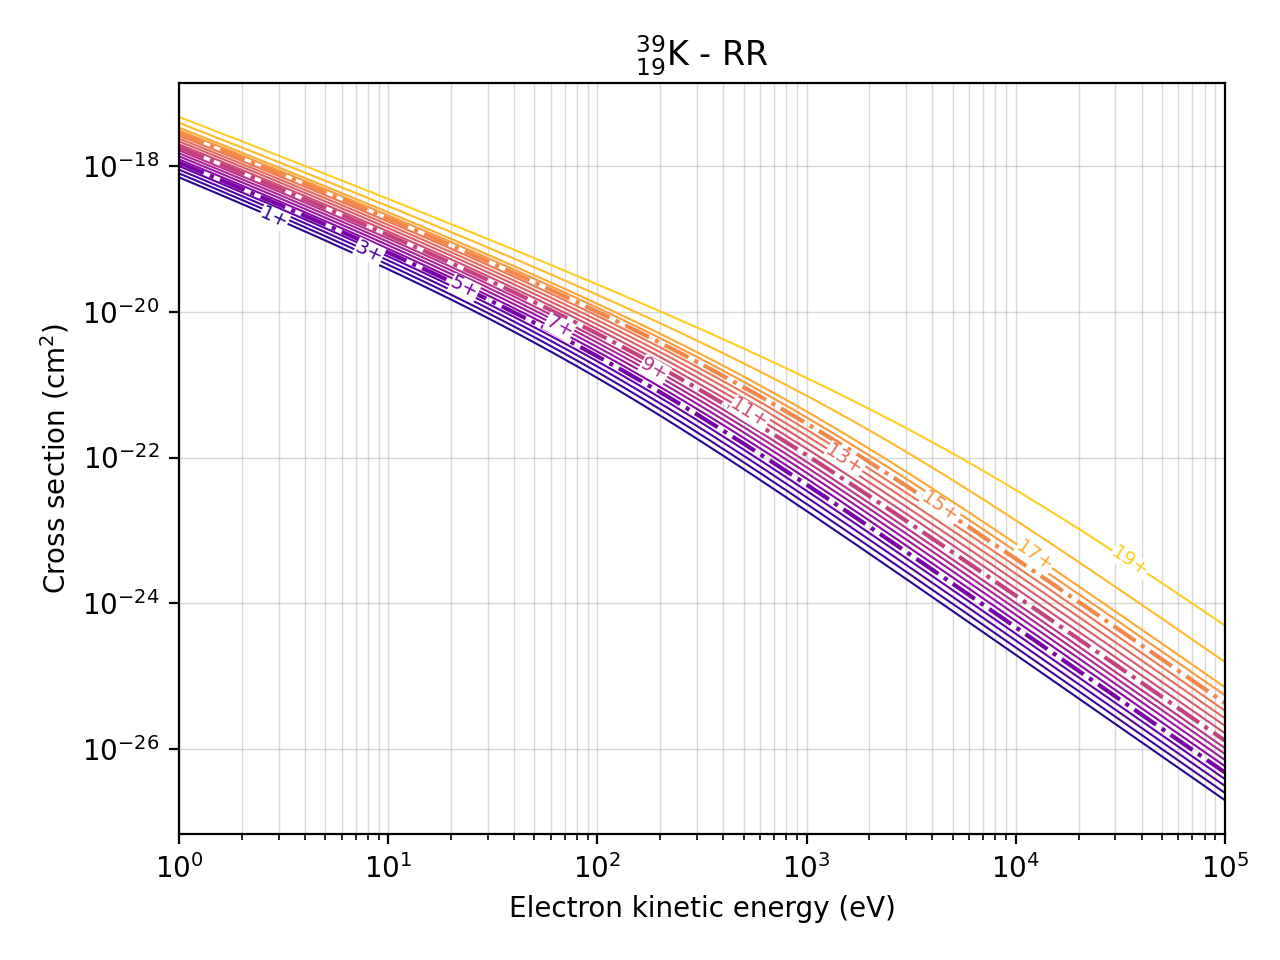
# This command produces the cross section plot for radiative recombination
eb.plot_rrxs(element="Potassium") # Based on name of element
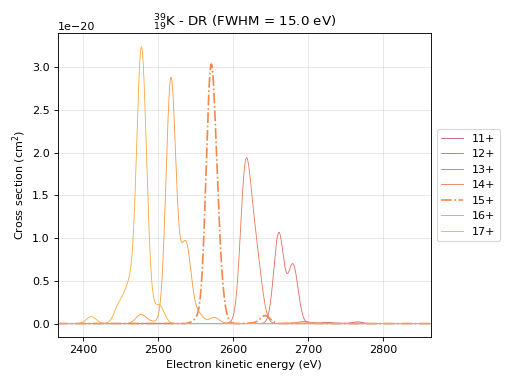
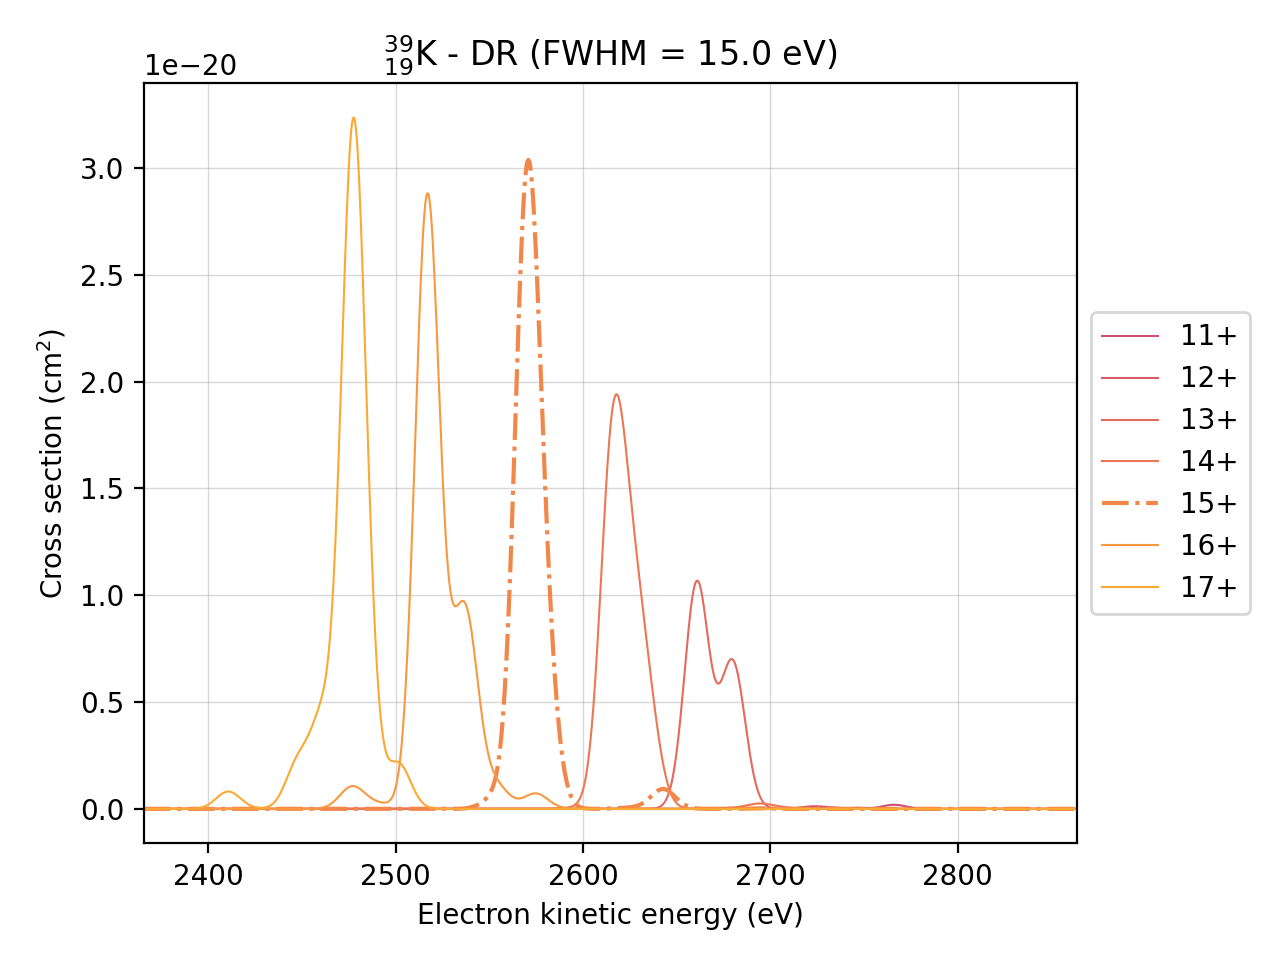
# This command produces the cross section plot for dielectronic recombination
# In addition to the Element the effective line width (eV) has to be specified.
# Typically the natural line width of a DR transition is much smaller than the energy spread
# of the electron beam, therefore a gaussian profile with a given line width is assumed for
# the transitions.
eb.plot_drxs(element="K", fwhm=15) # Based on element symbol
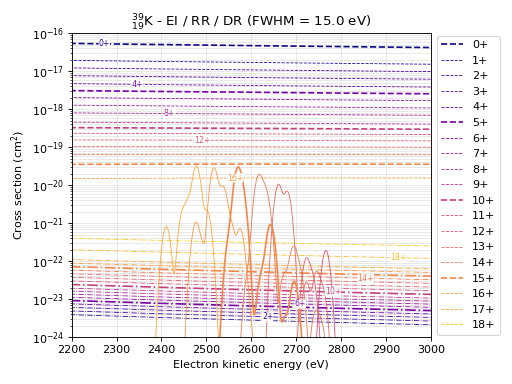
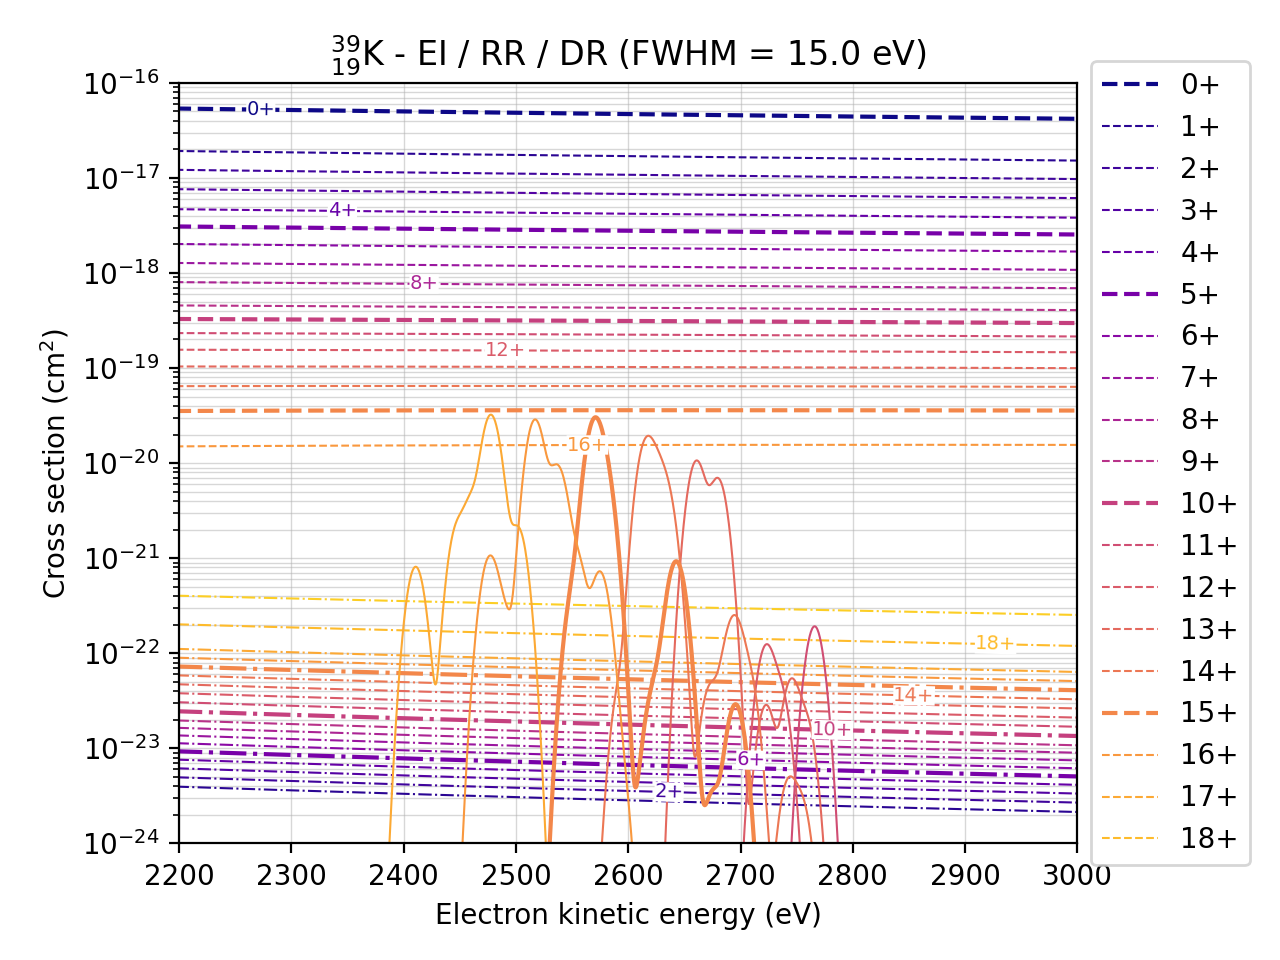
# It is also possible to compare all cross sections in a single plot
eb.plot_combined_xs(element=19, fwhm=15, xlim=(2200, 3000)) # Based on proton number
show()

